

Some of you may remember me from The Futures Focus. I stepped away about two years ago to focus on my own trading. The Market Lens below came from that: a weekly broad market analysis covering volatility, credit, breadth, sentiment, and technical structure.
A note for the futures traders on this list: this is the macro foundation. A paid Futures Desk section with analysis and trade breakdowns is planned.
Market Lens remains free.
VIX & Volatility Structure
The VIX has moved up this week from 17.2 at close Friday to 17.9 at the time of this writing, still inside the calm regime. But this doesn’t always tell the whole story and to get a more complete picture, I compare the implied volatility being priced in the SPX options market against what’s actually happening. The at-the-money (ATM) implied volatility (IV) is 17 while the 21-day realized volatility (RV) is at 10, which yields a 70% premium. The premium has expanded from 36% to 48% to 70% over the last few weeks, compared with the historical norm of 35-40%. This would indicate a widening of the volatility premium that the VIX itself isn’t reflecting. IV of 17 is a notable one week move from Friday (15.6), but this is only a one-week reversal, not a trend. This is consistent with either reading: a maturing calm regime or the early stage of the options market pricing forward risk.
On watch: If IV continues to climb while RV stays compressed, this would be an active widening of the volatility premium and could suggest a change in the volatility landscape ahead. This may not always be priced into the spot VIX that we see since ATM options give a clearer read on volatility than the VIX does, which is calculated across the whole SPX complex.
Credit & Bonds
The high yield option-adjusted spread (HY OAS) is a measure that compares higher risk corporate bonds against the Treasury curve. The HY OAS has ticked modestly higher over the last week from 275bps to 282bps, roughly in line with the second half of April but moving from what the Market Lens considers the ultra tight band (<280bps) to the calm baseline band (280-330). At 282, there is little room left to compress and the likelier path remains wider moves. With low OAS, we still have a setup for a repricing on any potential catalyst, of which there are many.
While high-yield corporate bonds are down on the week, they are still outperforming their investment grade counterparts, reflecting ongoing risk-on conditions. Treasuries continue their upward trajectory vs the HY group, but there is no signal that there is a major bid in the flight-to-safety trade right now. The 10 year yield is at 4.470%, up from 4.395%, which drove this ratio up.
On watch: 30-year Treasury yields moved over 5% on Tuesday, the highest reading since mid-2025. This level has acted as a pressure point for equities to varying degrees in recent years: In October 2023 this led a pullback low by several weeks and in early 2025, the first touch of 5% led the low by several months. More recently, the pullback low in late March came with the 30Y peaking at 4.998%, close but not exact.
Breadth & Leadership
Bearish divergence detected in breadth: The share of stocks trading above their 200-day moving average (structural breadth) fell from 57.3% a week ago to 52.8% today. The share of stocks trading above their 50-day moving average (intermediate breadth) fell from 65.9% to 54.7%. A decline in breadth while the index hits all-time highs signals that broad participation actively contracted over the last week.
RSP, which equal weights market cap of stocks in the S&P, has pulled back over 1% over the last week from all-time highs, so fewer stocks are participating in absolute terms. The MAGS/RSP ratio saw a very sharp move higher on Wednesday, an acceleration of a multiweek pattern. RSP/SPY ratio also made a sharp move lower on Wednesday, similarly an acceleration of a multiweek pattern which suggests that index-level gains are being fueled even more by megacaps.
On watch: Structural breadth breaking below 50% (psychological threshold) or seeing breadth continue to decline while the index holds steady or goes higher would widen this divergence.
Risk Sentiment & Positioning
AAII polls of individual investors showed that 39.3% were bullish, up from 38.3% a week prior and above the historical average of 37.5%. However, 36.6% were bearish compared with 33% a week prior, well above the historical average of 31%. Bears moved sharply higher while neutrals compressed from 28.7% to 24.1%.
I track bitcoin, ARKK, and the IPO ETF as risk appetite and sentiment proxies. Bitcoin is down about 1.8% week over week at time of writing, ARKK down about 1.8%, and IPO down 3.9%. ARKK’s decline makes sense within the context of breadth compressing, while bitcoin and IPO represent a divergence from the S&P at all-time highs.
Index & Technical Structure
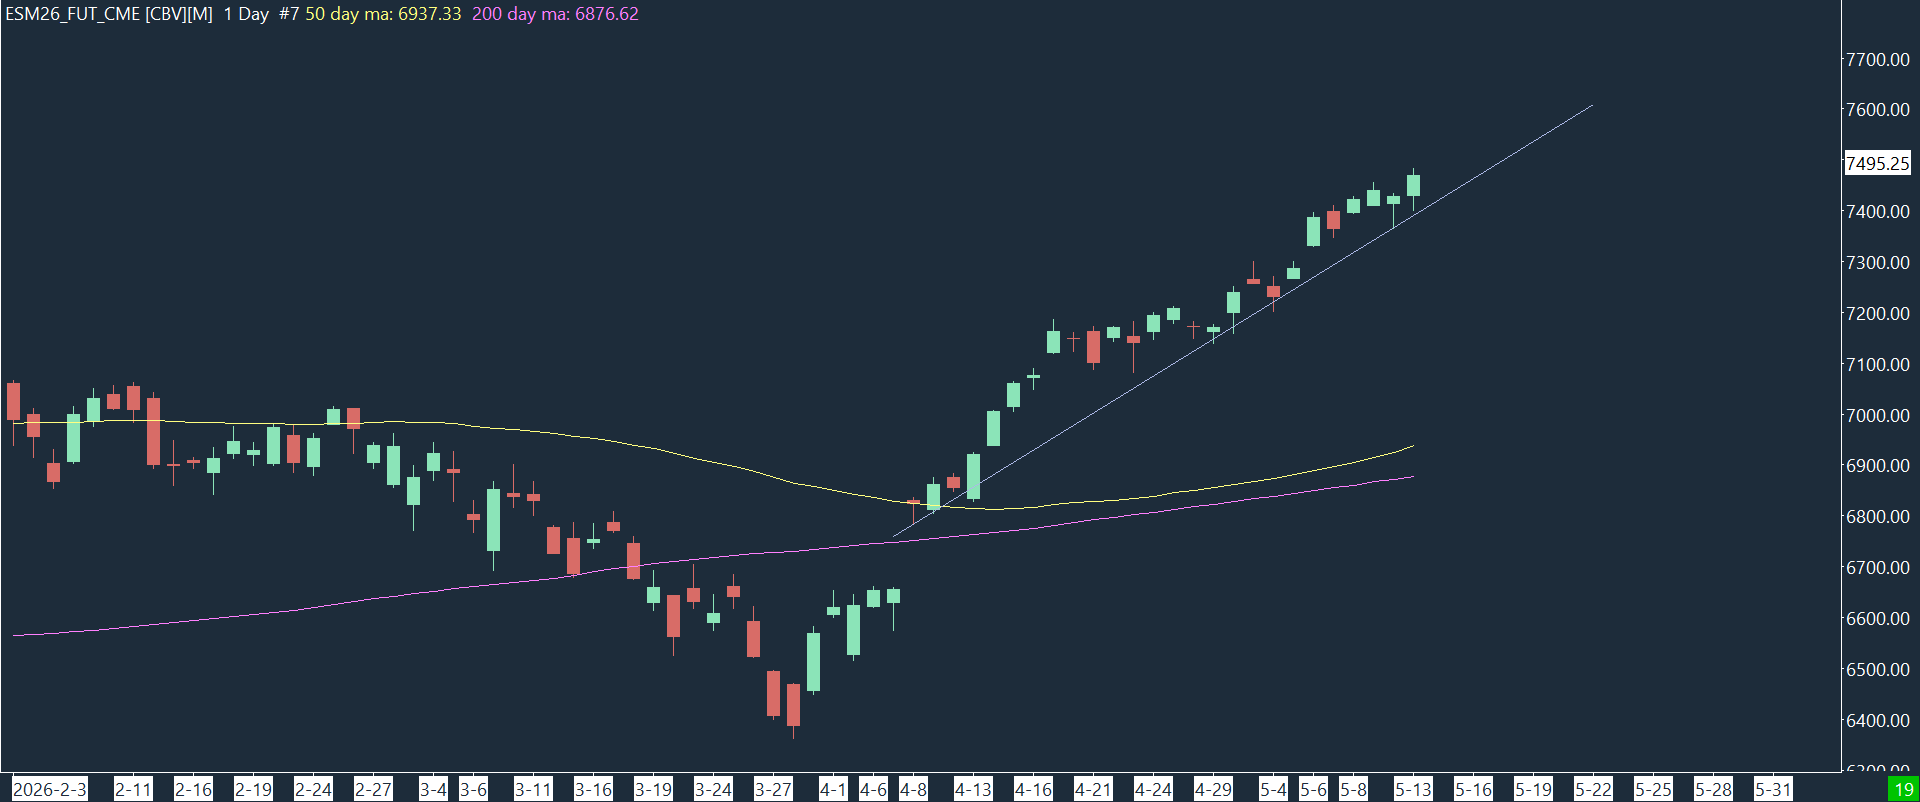
I do most of my work in the S&P index futures, which are in price discovery mode at all-time highs. In the chart of the week below, I frame the trend after the gap up on April 8th using the cash session (regular trading hours 9:30-4:00 EST, excluding overnight session), which coincides with the recovery of the 50- and 200-day moving averages. The bull case here would center on holding 7415 on Thursday and 7437 through week-end, which are the channel supports on Thursday and Friday.
You don’t need a MACD chart to know that momentum resides with the bulls, but it’s notable that the weekly MACD line is still below levels reached during the bull cycle in the second half of 2025. This can continue to improve even though the trend trajectory may be difficult to keep up; MACD doesn’t require sharp price increases, just sustained high prices. The histogram (gap between MACD and its signal line) is now in its fourth week of positive acceleration, demonstrating the sustained trend.
Stochastics are overbought at about 98 for the second straight week, a confirmation of trend strength rather than a mean reversion indicator. The K and D line are “pinching” (coming together), but a crossover here in the context of this trend is not a sell signal.
On watch: Price momentum remains strong while internals discussed above are deteriorating. Losing trend supports is the initial sign that the trend could pause. The more meaningful level could be 7428: a break there below last week’s value area highs would mean Wednesday’s breakout that drove the index to new all-time highs is being rejected and price is back inside of last week’s accepted range.
Welcome back man! You were huge in my development as a trader