

Bottom Line Up Front
Treasury/HY read followed through on last week’s setup into the resistance band and then backed off, in keeping with what we often saw over the last year, and well below the April spike. Calm credit and a relaxed volatility premium are still supportive of risk-on label, but retail bearishness and the broken cash-session trendline appeared.
VIX & Vol Structure
The VIX remains in calm territory at 17, a solid move lower from 17.9 a week ago. We saw implied volatility, which is calculated using at-the-money SPX options, drop from 17 to 14 (at time of writing on May 21) while realized volatility moved higher from 10 to 10.8. After three weeks of expansion, the volatility premium contracted this week from 70% to 29.9% vs the 35-40% norm, which implies that the volatility market has relaxed significantly.
On watch: From Monday-Wednesday this week, the spot VIX moved lower while the VVIX (volatility of the VIX itself) moved higher, with the ratio climbing from 5.1 to 5.6. For the most part, we see these move together and as of writing (May 21), the brief divergence has faded, though the ratio remains higher at 5.4 than a week ago and so while not an active divergence, worth keeping on the radar.
Credit & Bonds
The high yield option-adjusted spread (HY OAS) is at 286bps compared to 282bps a week ago, minimal drift that keeps the spread within calm baseline and still supportive of risk, but a small step towards the likelier wider ranges. Last week 30Y yields moved over 5%, and they moved even higher over this past week to 5.1% while the 10Y moved up from 4.47% to 4.6%. The MOVE, which reflects bond market volatility, is up 11 points to 81.5. This shows that most of the action is in rates and not in credit.
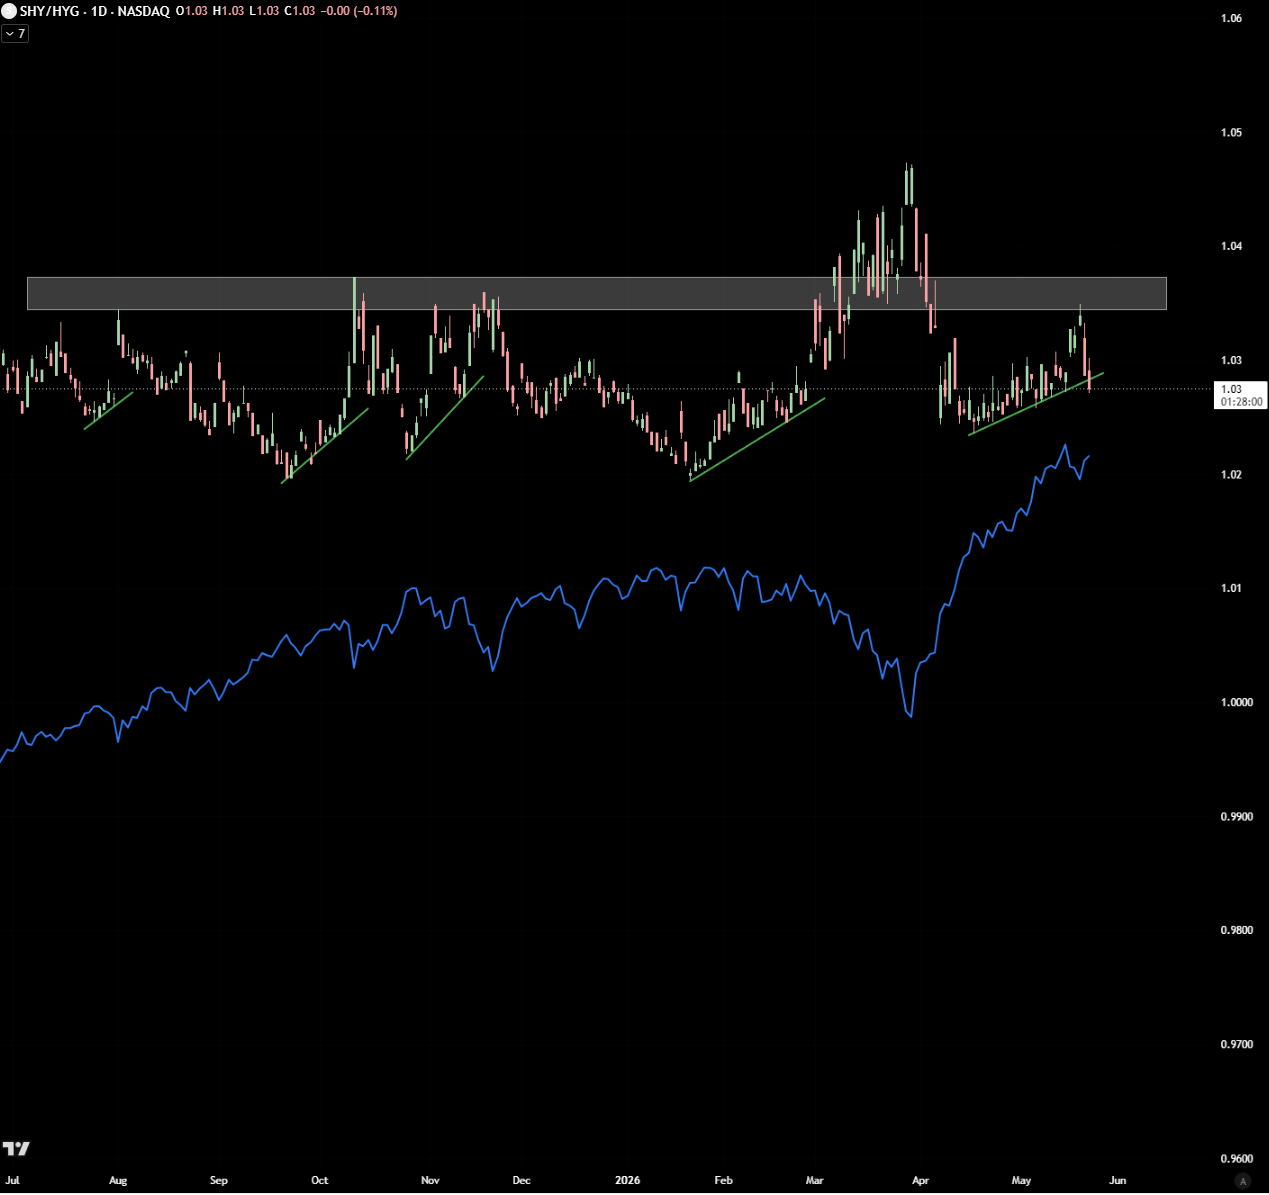
Last week’s newsletter flagged that Treasuries were moving higher against the high yield group, though without a major flight-to-safety trade yet. The chart of the week below shows the SHY/HYG ratio in the upper portion with the S&P overlaid below. This ratio compares short-term treasuries (safe bets) vs the riskier basket of high yield corporate bonds. We’ve seen over the past year that when the ratio approaches the resistance band marked on the chart we see dips in the index, with the ratio trending higher slowly, often gapping up, running into that resistance, and then backing off again. After the stress spike in April, the chart shows that the Treasury vs HY this month is not a repeat of the March-April variety and is actively fading.
On watch: The 30Y at >5% has been an equity headwind to varying degrees and remains on watch. In the SHY/HYG chart, the move lower from the resistance band has just broken down beneath the uptrend marked in green, so the flight-to-safety trade appears to be waning.
Breadth & Leadership
The share of stocks trading above their 200-day moving average (structural breadth) fell from 52.8% to 52.3%. The share of stocks trading above their 50-day moving average (intermediate breadth) rose from 54.7% to 55.2%. Sustained divergence between high prices and declining breadth, as well as structural breadth falling below the bullish-bias 50% mark, were highlighted flags a week ago. Both of the breadth levels dipped below 50% on Tuesday before sharp rebounds on Wednesday, indicating that breadth decline appears to be more of a quick bottoming out rather than a sustained issue.
RSP, which equal weights market cap of stocks in the S&P, fell less than half a percent since last week, so not much change in stock participation in absolute terms, but still fewer than we saw a couple of weeks ago. Over 4w and 12w, the RSP/SPY trends are still falling (-4.2% / -6.8%), MAGS/RSP is still rising (+6.4% / +10.5%), and IWM/SPY is falling (-3.4% / -1.6%), indicative of a concentrated, cap-weight-led market and not a clean, broad bull.
On watch: The MAGS/RSP ratio fell 1.4% week over week, which tells us that some of the magnificent seven dominance is in decline against the equal weight S&P, perhaps an early sign of broadening stock participation in the rally if it sustains. This is only a 1-week counter move, with the 4w and 12w trends pointing up.
Risk Sentiment & Positioning
AAII polls of individual investors showed rising bearishness for the second straight week, from 36.6% a week ago to 43.6% this week, well above the 31% historical average. The percent of bulls contracted accordingly from 39.3% to 31.7%, well below the historical average of 37.5%. The remaining 24.7% were neutral, roughly in line with 24.1% a week ago. We saw this sentiment appear in the Friday-Tuesday selling, which saw the largest pullback since this rally began in late March.
I track bitcoin, ARKK, and the IPO ETF as risk appetite and sentiment proxies. Bitcoin is down about 4.5% week over week, ARKK is down 3.5%, and IPO is up 1.4%. Bitcoin found resistance at the 200-day moving average again late last week, having traded below this key reclaim since late November. This period looks a lot like 2022 when bitcoin was in a bear market cycle, with the major difference being that the S&P was declining alongside it in 2022. It is currently finding some intermediate support at the 50-day, and could stand to base longer while the down sloping 200-day levels out a bit. ARKK is again down alongside breadth while IPO’s strength is explained by outperformance in ALAB and ARM.
On watch: Though we see retail-level fear, calm HY and VIX mean this is survey fear ahead of any confirmation. Next reading will be useful in seeing whether bearish sentiment fades or credit/volatility follow.
Index & Technical Structure
Bulls were unable to hold 7437 at the close last week, thus ending the cash-session-only uptrend that began April 8 and ran through May 15. Much of what we’re seeing right now though is live geometry and trajectory exhaustion: A steep trend slowed down and some retracement from overbought conditions occurred. Even with a recovery in prices from this recent dip, bulls would need to recover 7570, or another 90 points or so.
The MACD continues to show that shorter-term trend strength is pulling away from the longer-term average as shown by the growing histogram for the fifth straight week, even as price dipped. The slower momentum read also still favors bulls in spite of the recent cash-session trendline breaking.
Stochastics remain in overbought territory, but cooled off slightly from 98 to 96. I mentioned last week that overbought is more of a reflection of trend strength rather than mean reversion, and the stochastic reading could stay in overbought territory for weeks or longer.
On watch: Bulls made a push this week and their strength can be gauged by whether or not they reclaim 7570 or perhaps this pullback forms a higher low that we can use to redraw the trend.